Reporting that talks to the rest of your platform.
Interactive dashboards, P&L / Balance Sheet / Cash Flow statements, white-labeled monthly client reports, and consolidated views — all built on the same connected data.
See the business at a glance.
Pre-built and customizable dashboards surface the KPIs that matter — revenue, net income, cash balance, gross margin — alongside trend charts for revenue, net income, cash flow, expense breakdowns, AR/AP, and budget vs actual. Everything is pulled automatically from your connected accounting data (QuickBooks Online or Xero), with no manual export-import cycles. The simplified, client-facing Client Clarity dashboard gives clients their own plain-language view. A fractional CFO can land here and have a complete pulse-check in 30 seconds.

Demo data: Summit Gear Co. — the Classic Overview dashboard with KPIs, trend charts, and expense breakdown.
The deliverable your clients expect.
White-labeled PDF reports in your firm's branding, generated from connected accounting data — no manual assembly each month. Each report includes a financial summary, P&L, Balance Sheet, Cash Flow Statement, KPI commentary, and configurable additional sections, sent to clients on your schedule or generated on demand. It's the output a fractional CFO practice actually delivers as its monthly engagement. White-labeling is included on Growth and above.
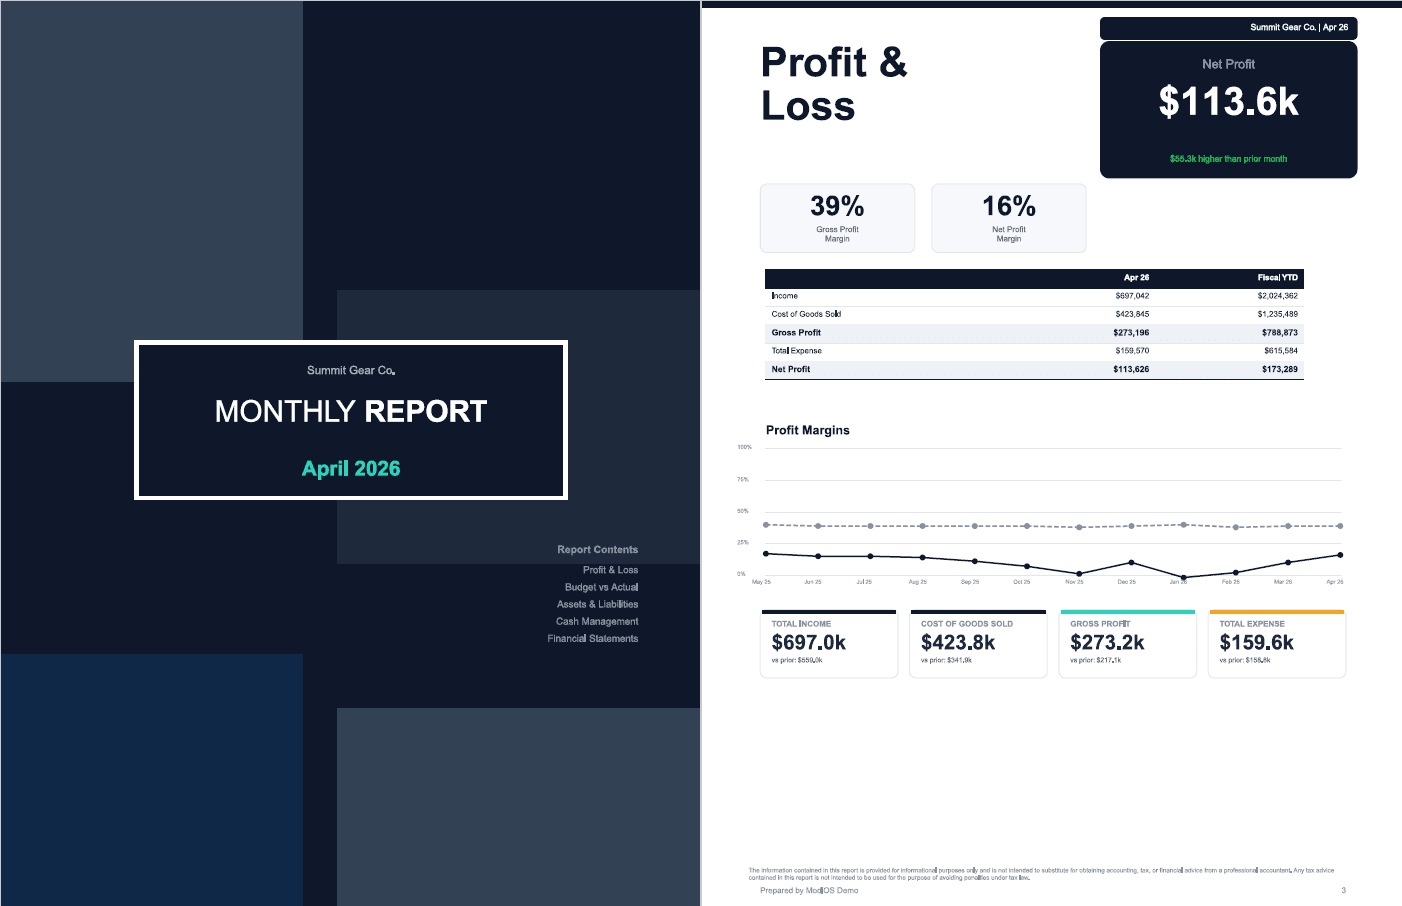
Sample monthly report for Summit Gear Co. — cover page and the Profit & Loss content page. Reports include your firm's name and branding.
Everything else in the reporting suite
Financial Reports
Standard P&L, Balance Sheet, and Cash Flow Statement reports across any date range. Customizable layouts and account groupings.
Budget & Forecast
Build budgets per account, compare actuals vs budget, and model rolling forecasts. Variance reporting built in.
Multi-Entity Consolidation
Roll up P&L, Balance Sheet, and Cash Flow across multiple legal entities into one consolidated view. Eliminations and inter-company adjustments supported.
Custom Dashboards
Configure your own dashboards with the widgets that matter to each engagement. Save layouts per client.
Export to PDF & Excel
One-click export of any report or dashboard to share with clients or import into other tools.
Connected Data
Live sync with QuickBooks Online and Xero. Manual CSV import for non-standard data.
One dataset, every surface.
Reporting in ModlOS isn't a standalone tool you tab away from to model or run the client meeting. The same connected data drives the dashboards, the financial statements, the monthly client deliverable, Lever Analysis, the 13-Week Cash Flow, and the Scorecard.
A KPI on a dashboard, a line item in the P&L, and a lever in the modeling tool all reference the same underlying numbers — no exports, no spreadsheet juggling, no version-control problems.
Core reporting on every tier.
See your clients' numbers on one platform.
7-day free trial — every feature unlocked, up to 3 companies, no credit card. Connect a file and watch the dashboards build themselves.