Model the levers that move the business.
Lever Analysis, 13-week cash flow, breakeven, business value, and forecasting — built into the same platform as your reporting and client deliverables, running on the same connected data.
See what a 1% improvement is worth.
Lever Analysis breaks performance into seven critical business levers — Price, Volume, COGS, Overheads, AR Days, Inventory Days, and AP Days. For each, it computes the annual profit impact of a 1% improvement, or the cash released by a one-day improvement. The dashboard shows the impact at a glance for current numbers; sliders let you model custom scenarios. The output is a specific figure you can put in front of a client — “improving price by 1% adds $65,998 to annual profit.”

Demo data: Summit Gear Co. — a projected $150,500 annual profit improvement from a 1% gain across all seven levers.
See shortfalls before they happen.
A rolling forward projection of cash position over the next 13 weeks, pulled automatically from the connected accounting system. When projected cash goes negative, it flags the shortfall and the week it hits. Override any projected weekly value to model “what if a customer pays late” or “what if we delay a payment” — it's the deliverable most fractional CFOs ship to clients every week.
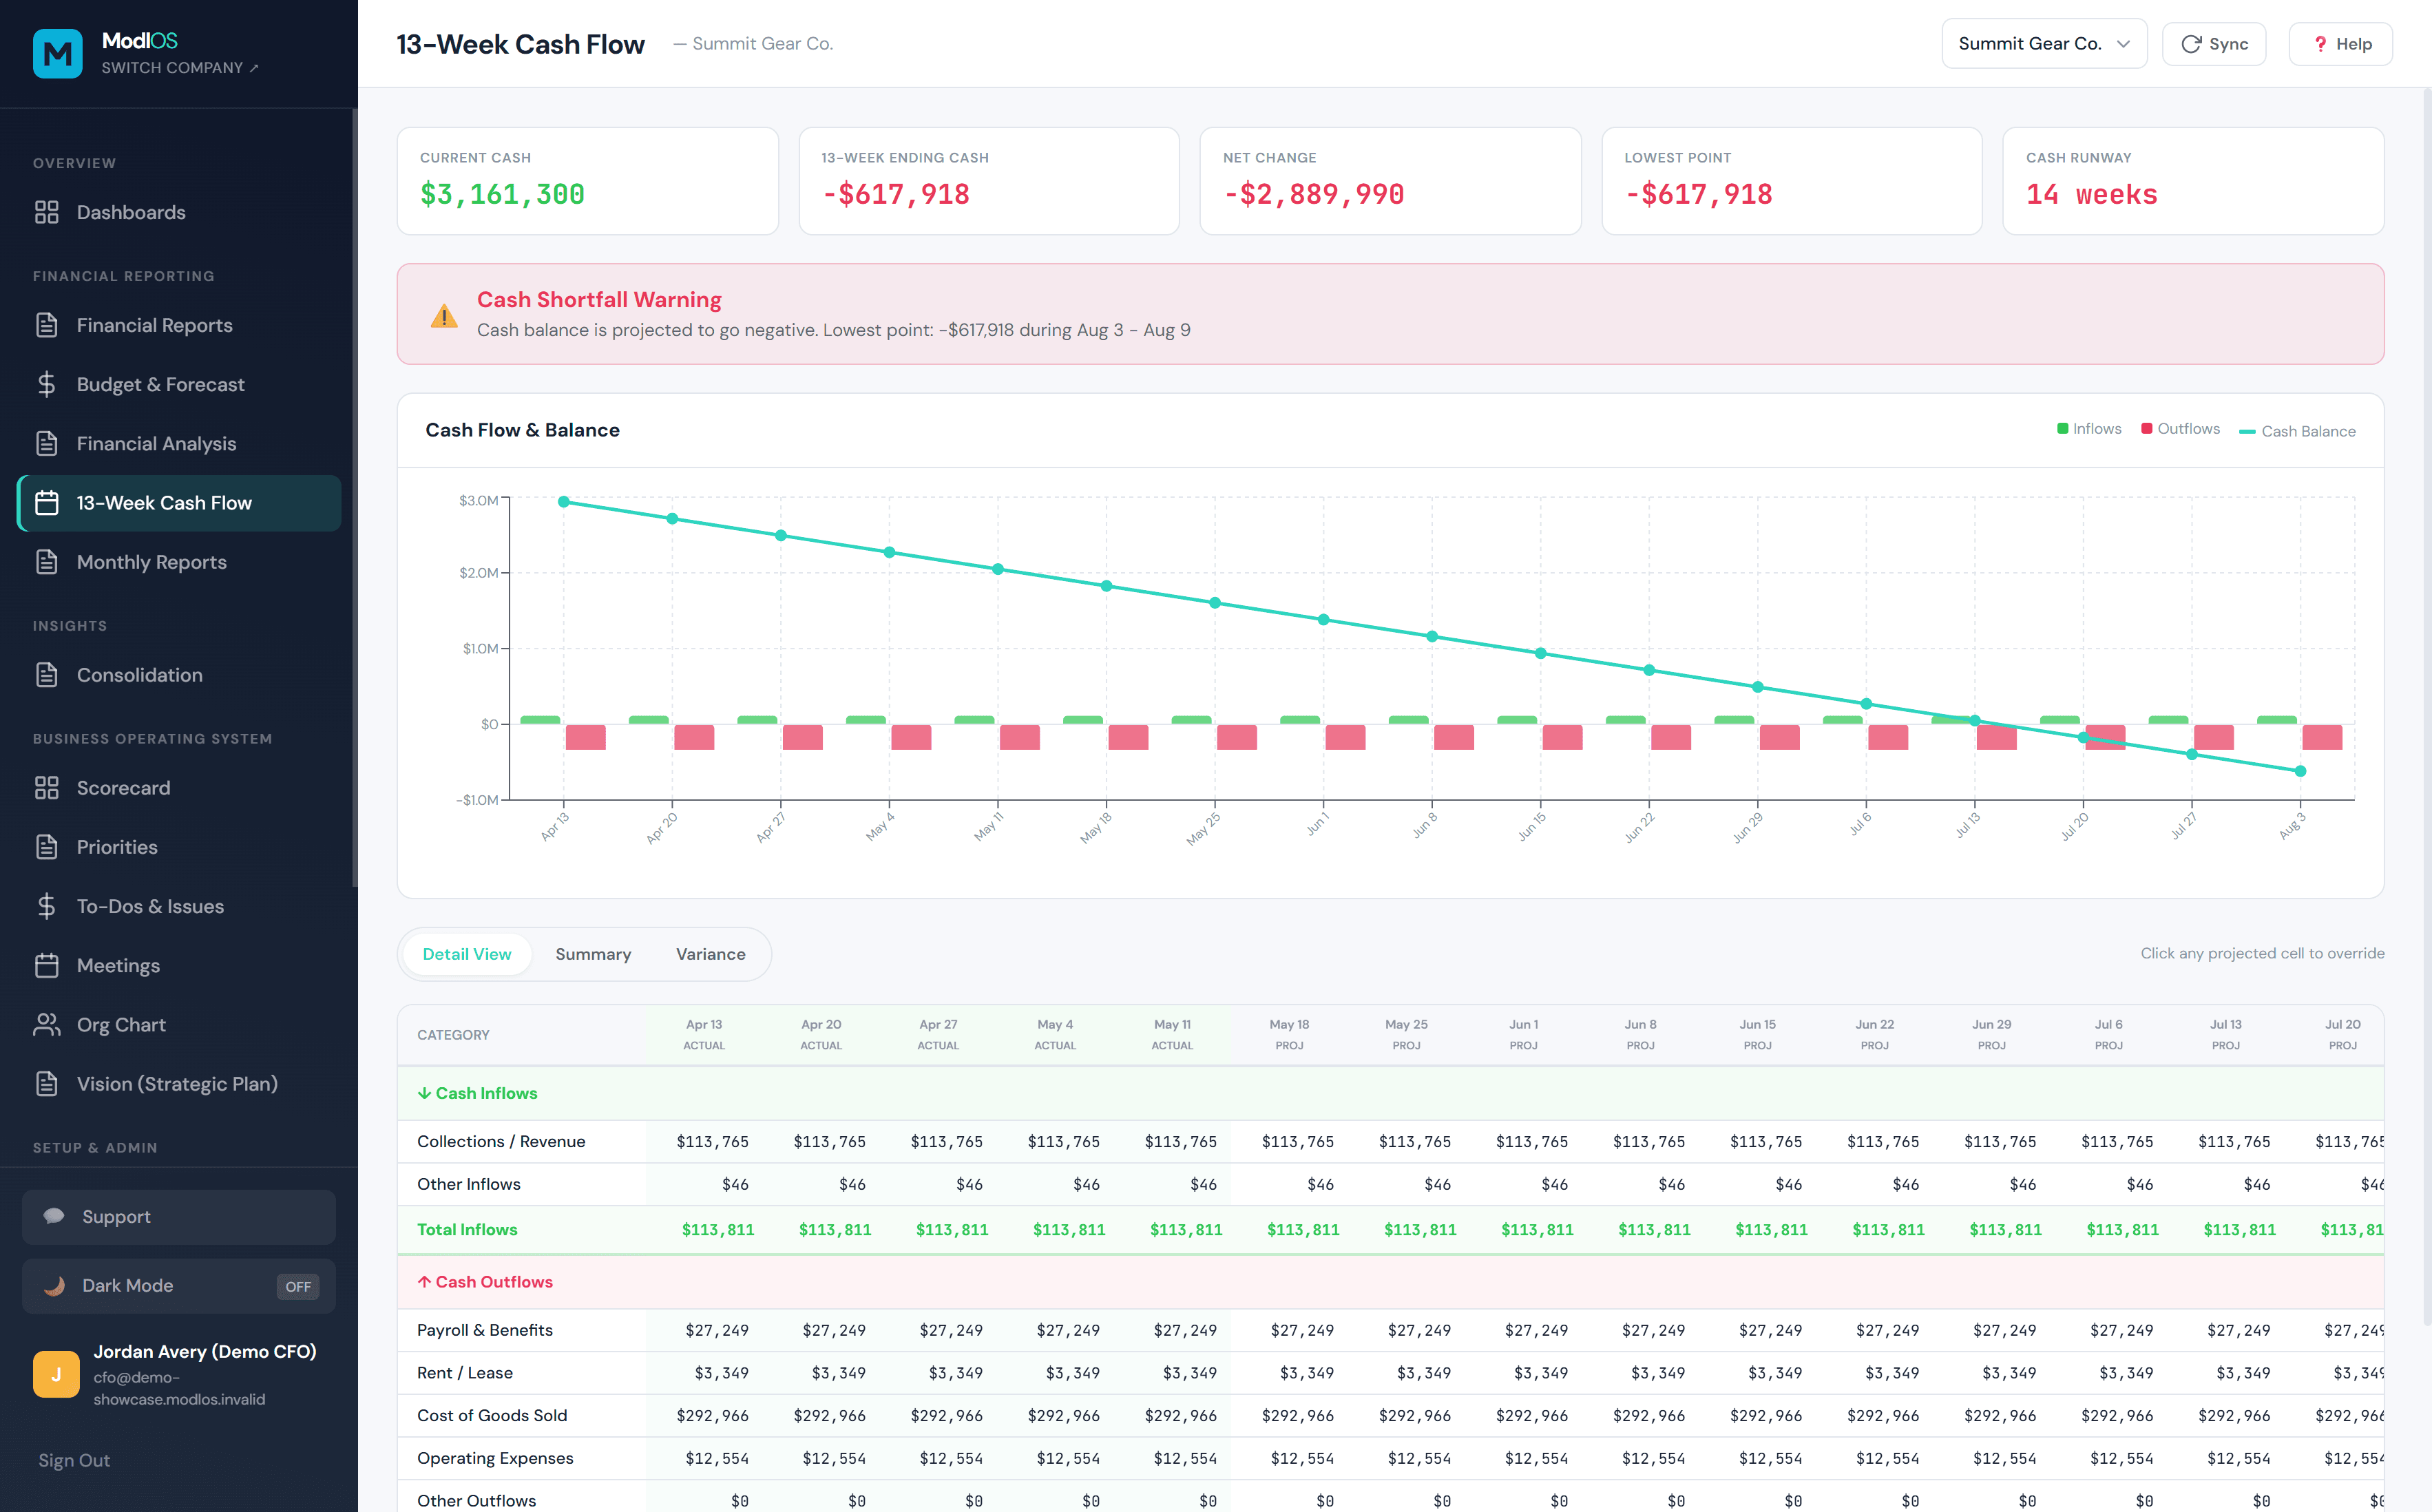
Demo data: Summit Gear Co. — the forecast surfaces a developing cash shortfall weeks before it would hit.
Everything else in the modeling suite
Breakeven Analysis
Compute the revenue required to break even. Test sensitivity to changes in margins, costs, or fixed expenses.
Cash Flow Forecast
Project cash flow over a multi-month horizon. Compare scenarios side by side.
Cash Flow Modeling
Build “what-if” scenarios for cash flow under different operating assumptions. Test the impact of pricing decisions, capital investments, or working-capital changes.
Financial Story
Walk through the numbers as a narrative — from profit to cash to value — making the model approachable for non-financial stakeholders.
Business Value
Estimate business valuation based on profitability, cash conversion, and growth. See how operational changes affect enterprise value.
Growth Capacity
Analyze how much growth the current cash position can sustain. Identify when growth needs financing vs. when it pays for itself.
One platform, from the number to the decision.
Reports and dashboards show what's happening. Modeling shows what could change and what the impact would be. The operating system tracks the work that gets done about it.
All in the same platform, against the same connected data — no exports, no spreadsheet maintenance, no version-control problems. You don't switch tools between viewing a P&L and modeling what to do about it.
Included in Growth and Pro.
Put a number on the next decision.
7-day free trial — every feature unlocked, up to 3 companies, no credit card. Run your own data through the modeling suite.